
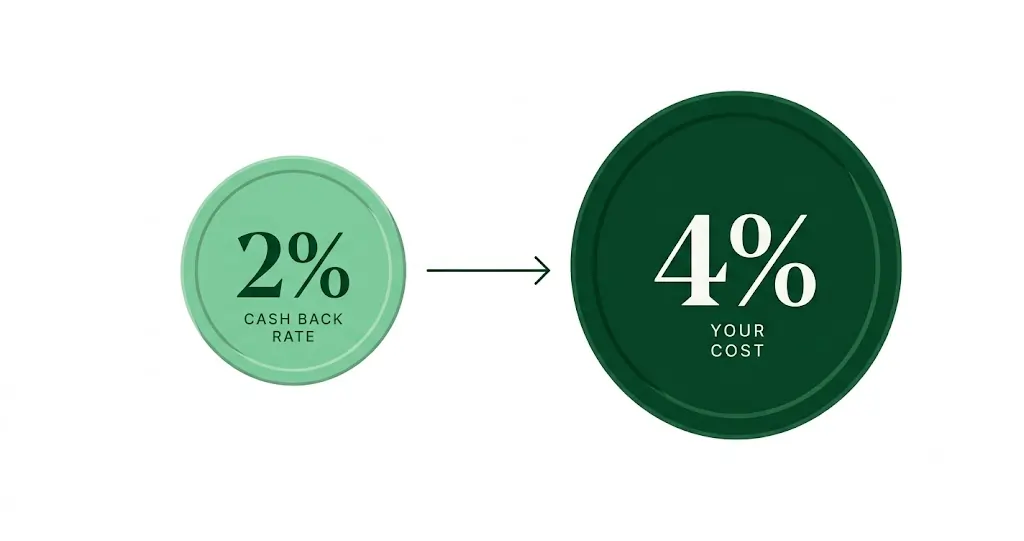
Every guide to the Rakuten Rewards affiliate program is written for the person clicking the orange Cash Back button, not the brand funding it. Rakuten’s own advertiser materials state the standard commission and Cash Back split plainly: 50/50. That means every 2% Cash Back rate you approve costs you 4% in commission, and most brands never run that math before they say yes.
Search “Rakuten Rewards affiliate program” and you get two kinds of results. One set explains how shoppers earn Cash Back. The other explains how publishers apply to join the network. Neither one answers the question a brand marketer actually has: what does it cost to have Rakuten Rewards in your partner mix, and is it earning its keep. That gap is what this article closes.
Rakuten Rewards vs. Rakuten Advertising: What the Affiliate Network Actually Is
Brands frequently talk about “Rakuten” as if it’s one program. It isn’t. Rakuten Advertising is the affiliate network and ad platform, the infrastructure brands use to manage tracking, contracts, and payouts across their entire publisher base. Rakuten Rewards is the consumer-facing Cash Back product, formerly known as Ebates, and it operates as one specific publisher inside that network (and increasingly, inside other networks too).
That distinction matters because the two businesses are on different trajectories right now. Rakuten Advertising’s platform infrastructure is consolidating into Impact under a strategic alliance announced earlier this year, a shift we cover in detail in our Rakuten migration playbook. Rakuten Rewards, meanwhile, keeps operating as a cashback publisher regardless of which platform sits underneath it. If Rakuten Rewards is already in your partner mix, the tracking and contracting layer is changing. The commission math in this article doesn’t.
Here’s what Rakuten Rewards actually brings to the table, according to its own advertiser-facing numbers:
Rakuten also reports a 72% member loyalty rate, which it frames as a retention asset for advertisers. That’s a real number worth taking seriously. Rakuten Rewards members are habitual shoppers who check for Cash Back before they buy almost anywhere. The question this article is built around isn’t whether that habit is real. It’s what you’re paying to be inside it.
The 50/50 Split, Run Through the Numbers
Rakuten’s own FAQ for advertisers spells out the mechanic directly: when a member activates a Cash Back offer and completes a purchase, Rakuten is credited with the sale and charges the brand a commission. Rakuten splits that commission with the shopper as Cash Back, and the standard split is 50/50. A 2% Cash Back rate requires a 4% commission. The brand funds both halves.
This is the part that gets lost in planning meetings. A marketing team looks at “2% Cash Back” and reads it as a small, consumer-friendly discount. What actually left the P&L is double that. Here’s the same math laid out across the rates brands typically negotiate, plus the elevated rates Rakuten runs during promotional events like Big Give Week and the Big Stack Event.
| Cash Back Rate Shown to Shopper | Commission You’re Actually Paying | Context |
|---|---|---|
| 1% | 2% | Low-margin or high-frequency categories |
| 2% | 4% | Common baseline rate |
| 5% | 10% | Typical mid-tier competitive rate |
| 8% | 16% | Aggressive acquisition push |
| 10%+ | 20%+ | Flash event floor rate (Big Stack Event) |
Math derived from Rakuten’s disclosed 50/50 commission split. Flash-event rates above 15% to 20% are often co-funded through incremental brand contribution on top of the standard structure, not a pure extension of the baseline split.
None of this makes Rakuten Rewards a bad deal. It makes it a deal that needs to be priced like the rest of your marketing budget, not treated as a rounding error because the number shown to the shopper looks small. A 5% Cash Back rate is a 10-point hit to gross margin on every transaction it touches. Run that against your actual product margin before you approve it, not after.
Cashback Affiliate Marketing vs. Content: What the Industry Data Shows
Cashback and loyalty partners behave very differently from content and creator partners, and the difference shows up clearly in industry benchmark data. impact.com’s 2025 Affiliate Benchmark Report, built on nearly a billion transactions across more than 2,300 North American retail brands, breaks out performance by partner type. Loyalty and rewards partners, the category Rakuten Rewards sits in, drove roughly half of all tracked transactions industry-wide while accounting for a third of brand spend and only 15% of clicks. Content and review partners moved in the opposite direction: 18% of clicks, 24% of spend, and just 9% of transactions.
On the surface, loyalty and rewards partners look like the more efficient channel: more transactions per dollar of spend than content. That’s real, and it’s also incomplete. Cashback share of the affiliate mix has been climbing industry-wide. The Performance Marketing Association’s most recent data, surfaced via EMARKETER, puts cashback and loyalty at 35% of total affiliate spend, the single largest category tracked, against 16% for content and editorial. Awin data reported by EMARKETER shows discount and coupon partners driving 42.4% of US affiliate revenue in the first half of 2025, up from 39.7% a year earlier. Cashback isn’t a niche tactic. It’s become the default center of gravity for a lot of affiliate budgets, often without anyone deciding that on purpose.
The Incrementality Question Nobody Asks
Here’s the trade nobody puts on a slide. A shopper who has Rakuten’s browser extension installed already intended to buy from you. They searched your brand name, or a friend sent them a link, or they saw your product on Instagram an hour earlier. The extension activates at checkout, right at the moment of highest existing intent, and the sale gets attributed to Rakuten on a last-click basis. You just paid a 4% to 10% commission for a transaction that had a real chance of happening anyway through organic search, direct traffic, or email.
That’s not an argument against cashback. It’s an argument for testing it instead of assuming it. Rakuten’s own case studies show what the channel can do when it’s aimed at something the brand actually needs. In one of its published examples, footwear brand FitFlop used Rakuten’s Personalized Rewards product to target elevated Cash Back offers at specific shopper segments rather than running a flat blanket rate, and reported a 149% increase in new-to-file buyers, 83% of them net-new to the brand. That’s an older example from Rakuten’s own materials, not a live benchmark, but the mechanism it illustrates still holds: cashback works best as a precision acquisition tool aimed at a defined gap, not a standing discount applied to your entire existing customer base.
The 50% of transactions loyalty partners drive isn’t the same as 50% of revenue Rakuten created. Most of it is revenue Rakuten intercepted on the way to happening anyway.
Revit DigitalThe brands that get burned by Rakuten Rewards aren’t the ones that use it. They’re the ones that never separate “transactions Rakuten touched” from “transactions Rakuten caused,” then wonder why a channel that looks efficient in the dashboard isn’t moving total revenue the way the attribution report suggests it should.
Running the Math on Your Own Program
You don’t need a data science team to get a real answer here. You need four checks, run in order, against your own numbers instead of industry averages.
Price the real commission, not the displayed rate
Take your current Rakuten Cash Back rate, double it under the standard 50/50 split, and add your network platform fee on top. Compare that all-in number against your product margin, not against your marketing budget as a percentage. A rate that looks affordable as a media line item can be unsustainable against a 35% gross margin product.
Pull the overlap between Rakuten referrals and brand-intent traffic
Look at how many Rakuten-attributed sessions arrive with your brand name already in the referring search query, or land on a product page a returning cookie has visited in the past 14 days. High overlap is the first signal that Rakuten is intercepting demand rather than creating it.
Run a suppression test
Pause your Rakuten Rewards placement for a defined window, or hold out a geographic or audience segment, and watch what happens to organic and direct conversion during that period. If total revenue barely moves while Rakuten’s reported revenue disappears, you’ve found your incrementality number. If total revenue drops close to what Rakuten was reporting, the channel is doing real work.
Compare cost per incremental sale against your content and creator partners
Once you know what share of Rakuten’s reported revenue is genuinely incremental, recalculate cost per sale on that adjusted number and set it next to what your content and creator partners cost per sale on a fully-loaded basis. That’s the comparison that should actually drive budget allocation, not raw transaction share.
What the Impact Alliance Changes
If you’re running this math and finding that Rakuten Rewards deserves a smaller, more deliberate role in your partner mix rather than a default one, you’re doing it at a useful moment. The Rakuten-Impact alliance means every brand currently on Rakuten’s own platform is migrating regardless of what this analysis concludes. That forced migration is a genuine opportunity to rebuild the commission structure around what the data actually supports, tiered rates for high-intent cashback activity instead of one flat number applied everywhere, rather than just replicating the old setup on new infrastructure.
We walk through how to handle that platform-level transition without losing partner relationships in the Rakuten migration playbook. If the bigger issue is that your whole affiliate partner mix, not just Rakuten Rewards, hasn’t been rebalanced in years, that’s a broader conversation about what a full program migration and audit actually involves.
Rakuten Rewards isn’t a channel to cut and it isn’t a channel to trust blindly. It’s a volume tool with a real, calculable cost, twice whatever Cash Back rate you approve, and a real incrementality question that almost no brand bothers to answer. Run the 50/50 math against your margin, run a suppression test against your assumptions, and let the answer, not the transaction count in your dashboard, decide how much of your affiliate budget it deserves.
Know What Your Cashback Partners Actually Cost You
We audit affiliate programs for golf, sports, and outdoor brands, cashback partner economics included, and rebuild the mix around what the data supports. If you’re migrating off Rakuten’s platform or just rethinking the role cashback plays in your program, see what a full migration and audit looks like, or reach out directly below.
Leave a Reply